Disease-Balance association in GutBalance
C

Click the image to see the HD version
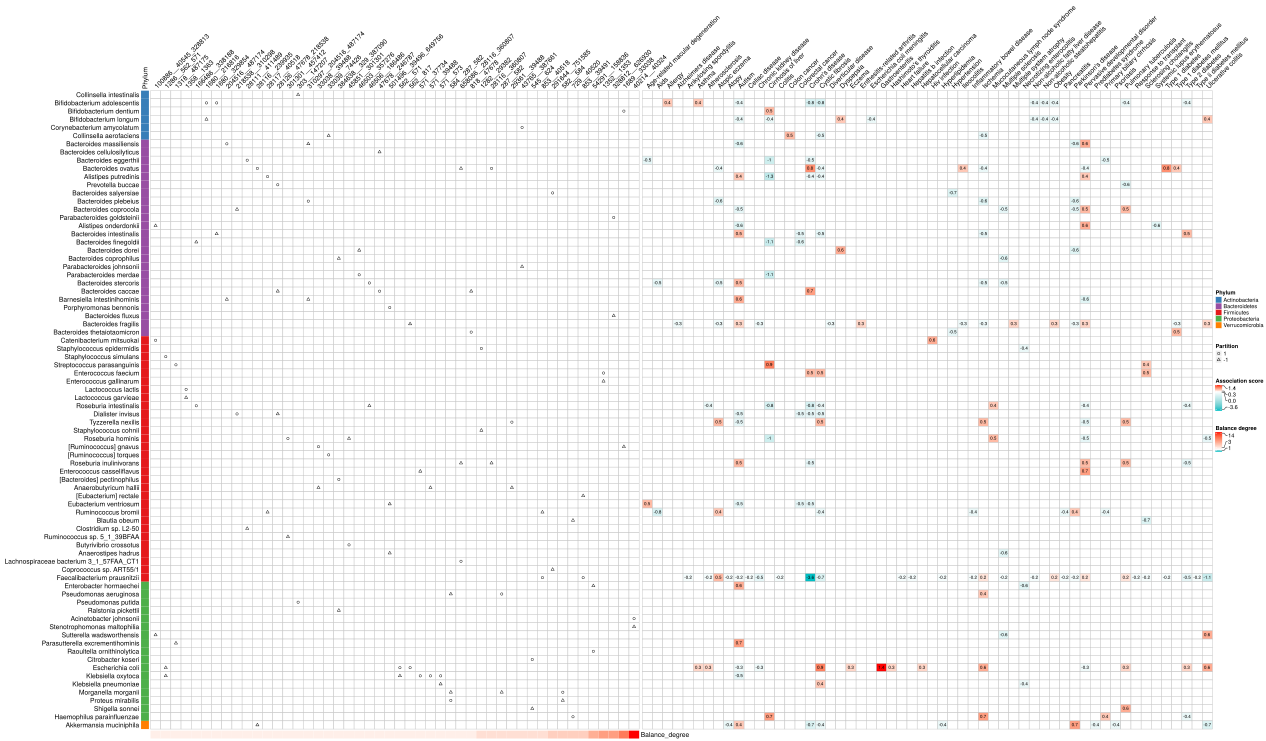
A. Network of all the disease-balance associations for all the 37 disease phenotypes from metagenome samples. The red nodes represent different diseases. The size of the disease node indicates the degree of the node, namely, the number of balances related to this disease. The disease nodes are labeled by the MeSH ids. The edges represent the associations with the absolute value of LR coefficient larger than 0.5. The width and the transparency of the edge indicate the absolute value of LR coefficient of the association. The color of the edge indicates the positive (red) or negative (blue) association. B. Heatmap of of top 20 disease-balance associations for all the 37 disease phenotypes from metagenome samples. The balances with degree larger than 2 (>=3) are specifically marked as red circles, which indicates these balances are positively or negatively correlated with multiple diseases. C. The heatmap of the species partitions of the balances with degree larger than 2 and the evidence score of the species-disease association in MicroPhenoDB.
C
Click the image to see the HD version
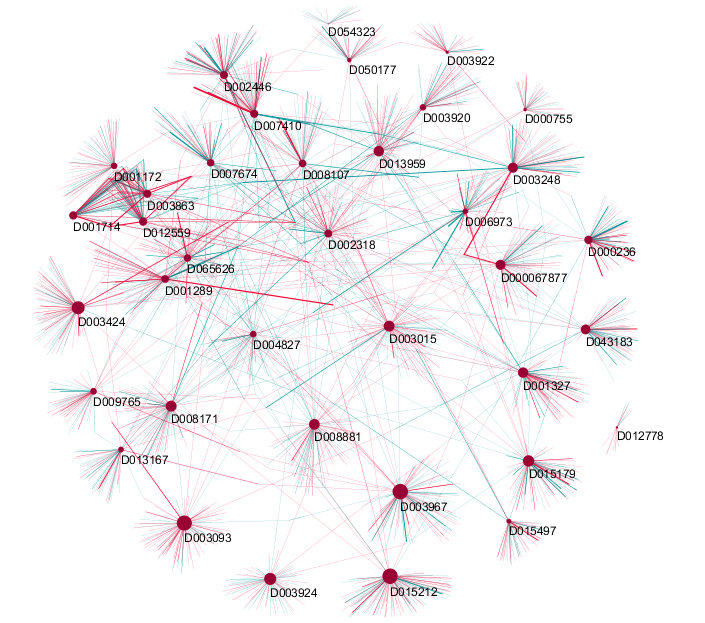
A. Network of all the disease-balance associations for all the 54 disease phenotypes from amplicon samples. The red nodes represent different diseases. The size of the disease node indicates the degree of the node, namely, the number of balances related to this disease. The disease nodes are labeled by the MeSH ids. The edges represent the associations with the absolute value of LR coefficient larger than 0.5. The width and the transparency of the edge indicate the absolute value of LR coefficient of the association. The color of the edge indicates the positive (red) or negative (blue) association. B. Heatmap of of top 20 disease-balance associations for all the 54 disease phenotypes from amplicon samples. The balances with degree larger than 5 (>=6) are specifically marked as red circles, which indicates these balances are positively or negatively correlated with multiple diseases. C. The heatmap of the species partitions of the balances with degree larger than 2 and the evidence score of the species-disease association in MicroPhenoDB.

